So I scrapped the full UTM solution seeing that Snort has some serious memory requirements. I did not want to add any other packages to this device. If you are curious as to what would have been done you can check out
SmallNetBuilder's UTM Guide. If I can obtain some better hardware I may move to a beefier solution, but for now, I will be happy just seeing more detailed firewall and IDS/IPS data.
So if you have worked with pfSense at all, you will notice that it has limited internal logging capacity. You can adjust but eventually logs will be overwritten. With the addition of Snort, you now have another important log to look at. There is an option for each of the managed interfaces in Snort to send data to the System logs, but remember, you will now overwrite those with more data. So best solution is to send all this information to a Syslog server. There are a couple solutions out there such as KiwiSyslog, but I sent the information to my Windows 2008 server running Splunk. There is a decent guide on
SeattleIT.Net. That one includes using the Google Maps app in splunk to track the geo-IP location of external hosts. The guide does contain two important config files needed, which is why I referenced it. You will need those so Splunk knows how to parse the information it receives from pfSense. On the pfSense box you will need to enable logging to a Syslog server. This is done from Status-->System Logs-->Settings (see fig 3.1).
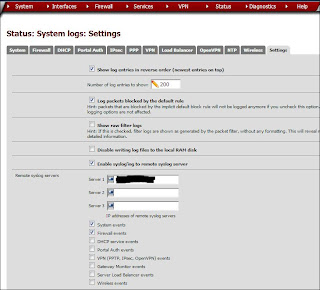 |
| Fig 3.1 - Log Settings pfSense |
From here you can add the server and the logs you want to use. Unfortunately, pfSense only supports the UDP port 514 for Syslog data. This is the default configuration, there are some guides out there that instruct you how to change this setting but that is beyond the scope of this discussion. One more thing needs to be done here before we head over to Splunk. I want to make sure I capture the Snort logs as well. I haven't found an individual setting for Snort in pfSense to send logs to an external source, but there is an option to send them to the System Log for pfSense. This will work out seeing that I already set the System logs up to go to a Syslog server. Head over to Services-->Snort and edit each interface you the logs for. You will want to check off the option to "Send alerts to the main lSystem logs (see fig 3.2).
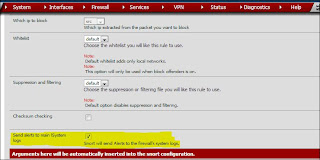 |
| Fig 3.2 Sending snort alerts to System Logs |
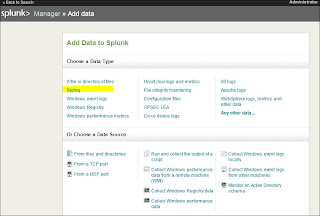
Now that we have logs to collect, it is time to turn on the feed in Splunk. This was tricky at first then I realized I made a dumb mistake and it worked perfectly. If you are using a Windows server with the firewall enabled, you may have to allow the UDP 514 traffic from the pfSense box. The easiest way to add the information to Splunk is to go under the Search section and "Add more data" (See fig 3.3).
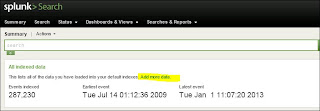 |
| Fig 3.3 Add Data to Splunk Search |
From the next section you will be able to choose the type of data you want to add. For this we will choose "Syslog" (See fig 3.4).
 |
| Fig 3.4 |
Choose the type of Syslog you want, for this I used "Consume syslog over UDP" (See Fig 3.5).
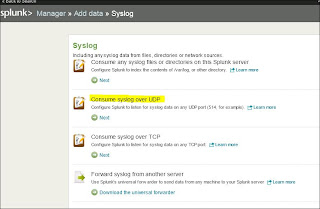 |
| Fig 3.5 |
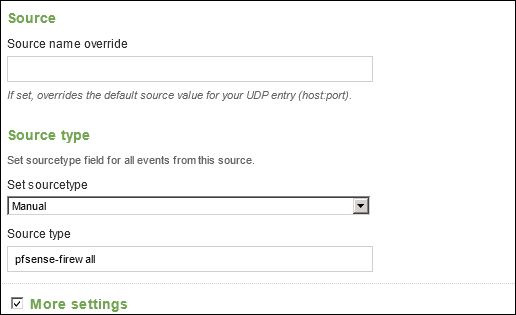
This brings you to the configuration screen. Set the port to 514 since that is the default used by pfSense. Then configure the remaining settings and check off "More Settings" for additional options (See Fig 3.6-7).
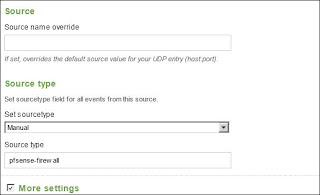 |
| Fig 3.6 |
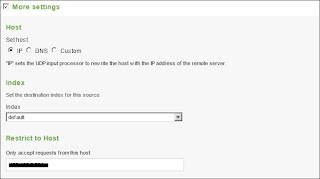 |
| Fig 3.7 |
Use the manual option for Source Type so you can set the correct name that coincides with the props.conf and transforms.conf files created in the SeattleIT.net blog.
Also notice in Fig 3.7 the "Restrict to Host" option. This will help lock down the what host Splunk will listen for, any other syslog servers will be ignored.
Once the Splunk server has been rebooted, you should start seeing information flow in from pfSense. At this point you can start searching for specific events from Snort or the Firewall logs. Right now the logs from Snort are mixed up with the System log activity of pfSense. If you choose the SourceType="pfsense-firewall" you will see only the firewall logs. For now I created an event type based off a simple search string 'source="udp:514" snort'. I will most likely move to pulling out the Snort logs as a separate feed but for now this will work just fine.
At this point I have called it a day and the initial project is done. I will most likely tweak the configuration and try pull out some more useful information that will assist in setting up some decent block rules in Snort. But that is enough work on my vacation and the Xbox is calling! If you have any questions, feel free to leave a comment or hit me up in Twitter. I hope you all kick the new year off right!